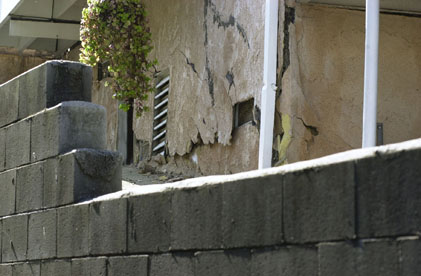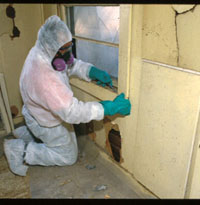
Building architecture that includes foundations, basements, roofs, and windows are among the types of capital repairs needed in public housing. FEMA/Laura Lee
In June 2011, HUD released a study of the costs of completing capital improvement repairs on the nation’s 1.2 million public housing units. If completed, these improvements would better the living conditions of some 2.1 million people.
This research, an update of a similar 1998 investigation, provides figures for meeting “existing capital needs,” the backlog of investment necessary to make housing decent and economically sustainable. The analysis also includes “annual accrual needs,” the inevitable costs that arise in the life cycle of housing. The total existing capital needs estimate is made up of several components. The largest component is based on onsite physical inspections, and is referred to as “inspection-based needs.” The total also includes other components of needs that are not based on inspections. These include the cost of lead paint abatement, the cost of accommodating persons with disabilities, and the cost of energy and water efficiency improvements that, through savings on utility bills, would pay for themselves in less than 12 years.
Study Design
Researchers conducted physical inspections of 548 nationally representative properties in 140 public housing authorities (PHAs). They looked at over 300 building, dwelling, and site systems, including foundations, roofs, windows, sidewalks, stairs, parking areas, utility distribution lines, boilers, bathroom fixtures, kitchen appliances, doors, flooring, and walls. The researchers developed a costing program that linked the observed condition of each system to the repair or replacement cost of restoring the system to original working order. The researchers also surveyed the PHAs about their expected future repair costs, and obtained data from the past five years about actual repair costs and expenditures. The sample included all developments with 500 or more units. Researchers focused on developments likely to remain as public housing.
Key Findings

In 1998, an estimated 430,000 housing units needed lead paint abatement, a figure that dropped to 62,000 by 2010.
-
The total existing capital needs estimate is $25.6 billion or $23,365 per unit.
-
The inspection-based portion of the capital needs backlog declined 3.4 percent from 1998 due in part to a 9 percent decrease in the public housing stock.
-
Annual accrual needs climbed 15 percent, to $3.4 billion annually.
-
Cost-effective energy and water efficiency improvements, like wall and attic insulation and low-flow showerheads, are estimated at $4.1 billion.
-
Dwelling unit systems, such as kitchens, bathrooms, and interior doors, are the largest category of existing needs at 39 percent. Building architecture systems (e.g., windows, exterior doors, roofs) account for an additional 34 percent of needs, site systems (e.g., water and gas mains, sidewalks, fencing) account for 19 percent of needs, and mechanical and electrical systems (e.g., utility distribution lines) account for 8 percent of needs.
-
There is a high degree of variation in existing needs. A quarter of all units have backlogs of under $5,248, and another quarter have backlogs exceeding $28,570. Relatively high existing needs are associated with large PHAs and properties that primarily serve families.
The researchers suggest that since 1998, the nation’s public housing stock has not deteriorated and may have improved. Researchers note that the degree of improvement relies on assumptions regarding the amount of inflation since 1998.
Addressing Repair Costs
A number of HUD programs address repair needs, including HOPE VI, which transforms severely distressed public housing; the Capital Fund Financing Program, which allows PHAs to borrow private funds to make improvements; and Choice Neighborhoods, which links housing improvements with community assets to transform neighborhoods into mixed-income, higher opportunity areas. In 2012, a new program, the Rental Assistance Demonstration, will convert public housing units into housing with long-term, project-based rental assistance contracts — a move that will allow PHAs to raise private capital that can be put toward much-needed repairs. Finally, the American Recovery and Reinvestment Act of 2009 provided HUD with nearly $4 billion in capital funds for public housing, which has boosted local economies while helping PHAs address some of their needs.
BACK TO THE TOP

The proportion of homeless persons in families increased from 30 percent in 2007 to 35 percent in 2010.
Good information is crucial for effectively combating homelessness. The size and scope of the problem has been difficult to gauge without good data on the size, characteristics, and needs of the homeless population, making the proper targeting of resources to eliminate homelessness difficult. This challenge is being addressed with a national initiative that is gathering momentum to count the homeless and to learn more about them — young or old; families or singles; male or female; black, white, or Hispanic; urban, rural, or suburban; chronic or acutely homeless; sheltered or unsheltered.
Nationwide, information is now regularly collected from two sources: local point-in-time counts of sheltered and unsheltered homeless persons on a single night in January and annual estimates of the total sheltered homeless, based on data from local Homeless Management Information Systems (HMIS). In the past six years, the number of communities participating in this data collection has grown to 411, resulting in a rough census of America’s homeless that can be followed from year to year to benchmark progress in the battle against homelessness.
The 2010 point-in-time count documented nearly 650,000 homeless people. Of these, 62 percent were using emergency shelter or transitional housing programs, while 38 percent had no shelter and were sleeping in cars, abandoned buildings, or on the street. This count reflects a 1.1 percent increase in homelessness since 2009. It also became evident that nearly two-thirds were homeless as lone individuals, rather than as part of a family unit. Homeless family households that consist of at least one adult and one child were more often living in shelters (78.4%) than not. These homeless family households increased in number by 1.2 percent between 2009 and 2010, and the number of homeless persons in these households increased by 1.6 percent (see table 1).
Table 1. Changes in Point-in-Time Counts of Homeless Persons by Sheltered Status and Household Type, 2009–2010
|
|
|
2009
|
2010
|
% change
|
|
Total
|
643,067
|
649,917
|
1.1
|
| By Sheltered Status |
|
|
|
|
|
403,308
|
403,543
|
0.1
|
|
|
643,067
|
649,917
|
1.1
|
|
By Household Type
|
|
|
|
|
|
404,957
|
407,966
|
0.7
|
|
|
238,110
|
241,951
|
1.6
|
|
|
78,518
|
79,446
|
1.2
|
| Source: Exhibit 2-2 of The 2010 Annual Homeless Assessment Report to Congress, 7. Note: Total point-in-time counts fell from 671,888 in 2007 to 643,067 in 2009 before experiencing an upturn in 2010. |
Over 1.59 million persons stayed at least one night in an emergency shelter or transitional housing during the 12 months from October 1, 2009 until the end of September 2010, according to the HMIS. The sheltered homeless population was concentrated in large cities (63.8%) and in the states of California, New York, and Florida, which accounted for just one-quarter of the U.S. population but 40 percent of the homeless population. Emergency shelters typically had shorter stays than transitional housing, with 20 nights being the median length of stay compared to 135 nights for transitional housing. Both types of housing were well utilized, with each averaging an occupancy rate of more than 80 percent. On the night before entering a homeless shelter, 39.1 percent of all residents were already homeless, 42 percent were housed in some manner, and the remainder were residing in institutional settings or other situations.
These findings and more are available in HUD’s 2010 Annual Homeless Assessment Report to Congress (AHAR) — the sixth such report on the extent and nature of homelessness in America.
This latest AHAR offers an overview of sheltered homelessness estimates from 2007 through 2010 that highlights some important shifts in sheltered homeless demographic and geographical trends, including the following:
-
Homelessness in rural and suburban areas appears to be on the rise. Average stays at emergency shelters tend to be shorter in suburban and rural areas than in urban areas, possibly owing to this increase in demand.
-
The percentage of persons in families has gone from 30 percent of the homeless population to over 35 percent.
-
The white, non-Hispanic sheltered homeless population doubled in suburban and rural areas, from 151,107 in 2007 to 307,468 in 2010.
-
The number of unsheltered chronically homeless persons has declined 20 percent since 2007.
For the first time, the 2010 AHAR contained information on those served by permanent supportive housing (PSH) programs. The formerly homeless PSH residents are twice as likely as shelter residents to have a disability, more likely to be female, less likely to be Hispanic, more likely to be black, and less likely to be alone in a one-person household. The nearly 237,000 PSH beds in the U.S. are proving to be an essential tool for alleviating homelessness. Stays in PSH are longer and the anticipated annual turnover is 15 to 20 percent. Turnover fell within this range in 2010, and the most common destination was rental housing (38.4%), followed by living with a family member (14.6%).
The report is also the first to present findings from the Homelessness Prevention and Rapid Re-Housing Program (HPRP). This initiative, funded through the American Recovery and Reinvestment Act, made $1.5 billion available to state and local governments to prevent at-risk households from becoming homeless and to rapidly rehouse local homeless populations. HPRP served more than 690,000 people in 284,000 households in its first year, most of whom (77%) received homelessness prevention rather than rehousing services. Most participants were in the program for two months or less. Of those who participated in HPRP and whose destination was known when exiting the program, 94 percent went to permanent, mostly rental, housing situations.
BACK TO THE TOP

In a weak economy that leads to tighter underwriting standards, FHA helps provide stability and liquidity, as seen in 2008 and 2009 when its market share for minorities increased significantly.
Historically, Federal Housing Administration (FHA) home mortgage programs have played an important countercyclical role in the market. Prime conventional lenders and private mortgage insurers typically curtail their risk exposure in regions experiencing a recession by tightening underwriting standards, limiting lending to only the most creditworthy applicants. Subprime lenders often curtail lending more severely when funding sources for higher risk loans become scarce. FHA, on the other hand, maintains its presence in all markets, providing stability and liquidity during a recession.
Because all FHA borrowers must pay a mortgage insurance premium, many homebuyers who can qualify for conventional lending with less costly private mortgage insurance do so when the local economy is robust. Thus, during good times, FHA home purchase mortgage market share may decline. When the local or national economy is weak, however, conventional lenders or private insurers tighten underwriting standards to reduce their risk, and FHA market shares increase as FHA continues to provide liquidity. In the post-2007 market, nearly all U.S. regions have experienced rising defaults and foreclosures, severely curtailing conventional mortgage liquidity. This nationwide tightening of conventional credit is why the recent increase in FHA overall home purchase mortgage market share has been extraordinary.
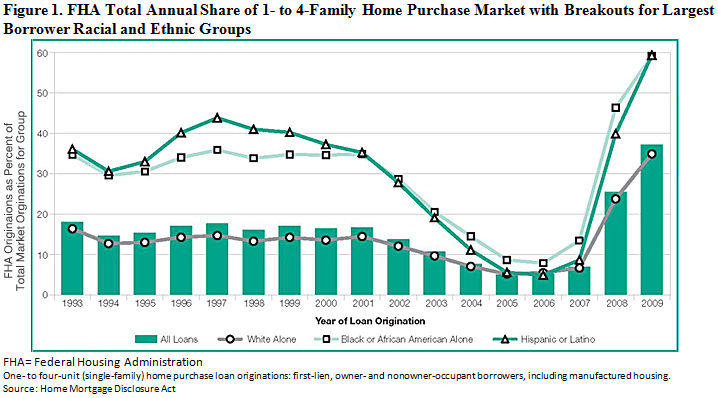
As Figure 1 shows, the FHA share of the home purchase mortgage market averaged about 16 percent annually from 1993 through 2001. The mortgage market in the 1990s was composed of conventional prime and government-insured sectors, especially in the home purchase segment for which subprime conventional loans were less prevalent. Thus, variation in FHA home purchase mortgage market share in the 1990s was primarily related to changes in mortgage interest rates. Whenever mortgage interest rates declined, FHA’s market share declined and, proportionally, more borrowers could qualify for a conventional mortgage.
After 2001, FHA home purchase mortgage market share declined from more than 13 percent in 2002 to approximately 5 percent in 2005 and 2006. Sustained low interest rate levels were the primary cause of the initial decline in FHA market share. The availability of innovative but risky subprime and nontraditional mortgages, however, along with expedited underwriting decisions made possible by automated underwriting advances (or, as some analysts have conjectured, a near absence of underwriting), had increasing appeal to homebuyers facing ever higher home sales prices. These trends increased the number of borrowers who could purchase a home without lending assistance from the FHA, leading to further decline of its market share.
FHA’s home purchase mortgage market share increased dramatically in 2008; the conventional market tightened underwriting, especially in nontraditional sectors; and the home purchase mortgage market contracted along with falling home sales prices. FHA share, as reported by Home Mortgage Disclosure Act data, increased from approximately 7 percent in 2007 to 26 and 37 percent, respectively, in 2008 and 2009. For racial and ethnic minorities, particularly blacks and Hispanics, the swings in FHA market share during this period were even greater. Figure 1 shows that among borrowers in these two racial and ethnic groups, FHA shares peaked in 1997 at 36 percent for blacks, and 44 percent for Hispanics. Their respective FHA shares declined rapidly between 2001 and 2006, with the share for blacks dropping to 8 percent in 2006 and the share for Hispanics falling even more to 5 percent in that year. It’s likely that a relatively higher proportion of racial and ethnic minority homebuyers, who until the peak boom years had been choosing more sustainable FHA financing, were attracted to the subprime and nontraditional conventional market sectors during the boom years of 2002 through 2006.

In 2008 and 2009, the increase in FHA share for blacks and Hispanics was even greater than that of FHA as a whole. In these 2 years, FHA shares increased to 46 and 59 percent, respectively, for blacks, and to 40 and 59 percent, respectively, for Hispanics. Blacks and Hispanics appear to have been affected more by the tightening of prime conventional underwriting requirements during these two years; the contraction of the subprime and nontraditional loan markets resulted in a relatively greater need for FHA’s less restrictive underwriting requirements.
As the market undergoes institutional changes to prevent future boom/bust cycles, the ability of the prime conventional market to serve racial and ethnic minority homebuyers is likely to be an issue of concern to policymakers.
BACK TO THE TOP
|


