All That CHAS: Use Cases for the Comprehensive Housing Affordability Strategy Dataset
Blair Russell, Social Science Analyst, Office of Policy Development and Research
Madeleine Parker, Social Science Analyst, Office of Policy Development and Research

In Boring, OR, 100 percent of households with income below 30 percent of HUD Area Median Family Income pay more than half of their income on housing. Photo credit: iStock.com/hapabapa
The Comprehensive Housing Affordability Strategy (CHAS) dataset is managed by HUD's Office of Policy Development and Research (PD&R) and is a custom tabulation of the U.S. Census Bureau's American Community Survey (ACS) estimates that was created to meet the consolidated planning needs of HUD grantees. CHAS provides information on housing characteristics, including housing quality (lack of adequate kitchen and plumbing facilities), overcrowding, and cost burdens, by household income relative to local area median incomes and other household characteristics. State and local jurisdictions participating in formula block grant programs through HUD's Office of Community Planning and Development (CPD) (such as the Community Development Block Grant and the HOME Investment Partnerships programs) use CHAS data to assess their affordable housing and development needs and market conditions. PD&R preloads the annually updated dataset into the consolidated planning web portal that grantees use. The value of CHAS, however, extends well beyond consolidated planning at the grantee level. The dataset is a critically important source of information for researchers, program administrators and evaluators; many of HUD's formula allocations, applications for competitive grants, and academic research incorporate CHAS estimates.
Users can download CHAS data at the state, county, county subdivision, place, and census tract level. All observations include geographic identifiers to simplify linking to other geoidentified datasets. CHAS also includes a query tool to provide several commonly needed estimates quickly. The query tool provides downloadable CHAS data from 2021 (the most recent dataset available) to 2009. CHAS data from the 2005 to 2007 ACS, 2000 decennial census, and 1990 decennial census also are available for download at specific geographies.
This article introduces readers to CHAS by illustrating some of the use cases for researchers and program administrators. The CHAS dataset's custom-recoded variables give it many unique features that other data sources cannot replicate. The examples in this article use data from the most recent CHAS dataset, which is based on 2017 to 2021 ACS 5-year estimates.
CHAS income categories compared with national poverty thresholds
Many CHAS tables use HUD-designated income categories that reflect the level of household income relative to the HUD Area Median Family Income (HAMFI). Standard ACS tables categorize incomes based on whether household earnings are greater or less than national poverty guidelines set by the U.S. Department of Health and Human Services. National poverty thresholds are the same throughout the contiguous United States; Alaska and Hawaii have higher thresholds due to higher local costs of living. Conversely, CHAS income categories such as household income of less than 30 percent or between 50 and 80 percent of the HAMFI provide a more nuanced view of how household incomes fit within the local income distribution. Households with incomes well above national poverty guidelines but on the lower end of the HAMFI distribution may lack sufficient income for basic needs in areas with higher-than-average median incomes and costs of living, which the CHAS income categories capture. Both the CHAS income limits and the poverty guidelines are adjusted for household size.
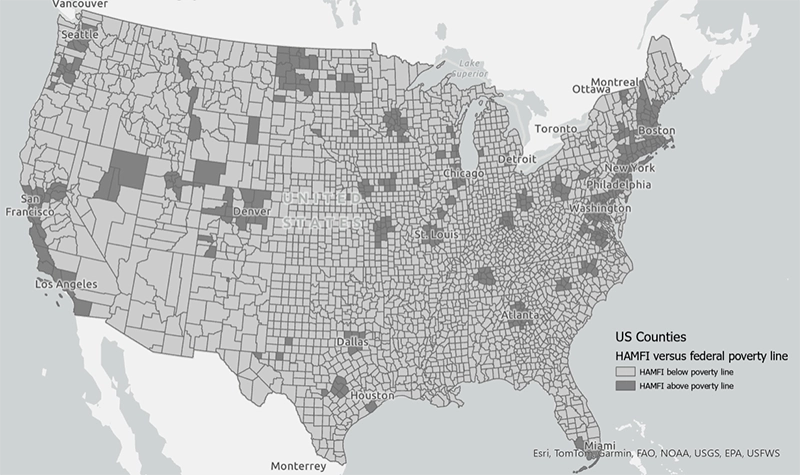
Figure 1 shows the counties in which the CHAS income limit for households earning less than 30 percent of HAMFI is greater than the national poverty threshold. The CHAS income limit for households earning less than 30 percent of HAMFI often (but not always) is defined as extremely low income (ELI) for HUD programs. In many locations, particularly those clustered around urban areas, the CHAS 30 percent of HAMFI limit is above the federal poverty level. These areas include high-cost cities, including much of the northeastern United States and California, but also other areas, including smaller and lower-cost cities. This finding is important because the percentage of HAMFI that CHAS uses offers a more nuanced understanding of a household's relative economic standing, particularly in these parts of the country, where a household whose income exceeds the federal poverty level may still experience significant financial burdens because of the local cost of living.
Figure 1: 30 percent of HAMFI (ELI) compared with federal poverty level for counties in the continental United States

CHAS tables were designed to support HUD in serving its mission "to create strong, sustainable, inclusive communities and quality affordable homes for all." The information in the CHAS dataset illustrates communities' strengths and weaknesses in sustainability, inclusivity, quality, and affordability. The remainder of the article will demonstrate how specific CHAS tables provide information on these community characteristics.
Housing cost burden example: Boring, Oregon
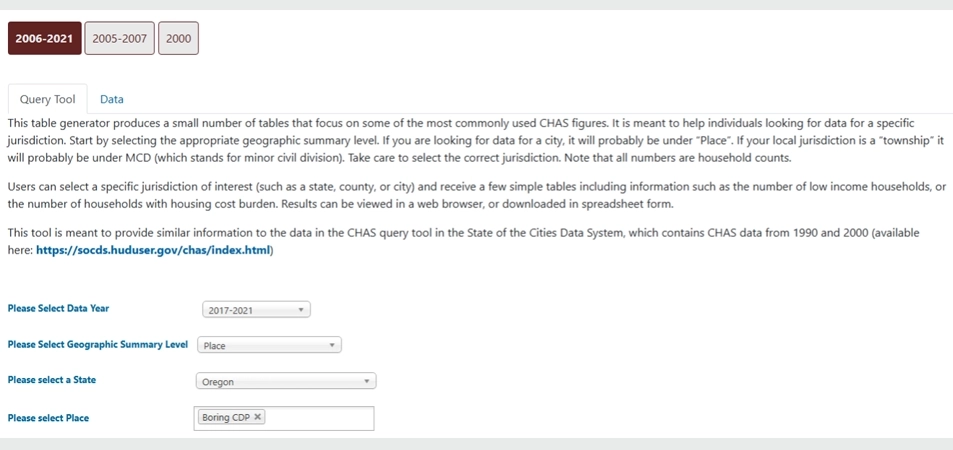
To liven up what might otherwise be a dry — some might say boring — subject, we will highlight use cases in some of the country's more unusually named communities. Our first stop is the census designated place of Boring, Oregon (population 1,931). Let's say a researcher wants to learn how housing cost burden varies across income groups in this community. Their first step should be to access the CHAS Query Tool, which generates summary tables for some of the most commonly used CHAS elements. In this case, the researcher wants to examine the variables of household income and housing cost burden, which the Query Tool can readily generate. Figure 2 shows the four fields that the user would select, including data year and geographic level.
Figure 2. Query Tool selections for Boring, Oregon

Table 1 below shows some of the information that the Query Tool returned pertaining to housing cost burden for owners and renters. Researchers can also use CHAS to separately analyze owner cost burden and renter cost burden. In Boring, 100 percent of households earning incomes of less than 30 percent of HAMFI spend more than half of their income on housing. Conversely, no households in the community earning more than the area median spend more than 30 percent of income on housing.
Table 1. Housing cost burden by household income category in Boring, Oregon
Housing Cost Burden |
|||
Household Income as a Percentage of HAMFI |
<-30% |
30.1-50% |
>50% |
<= 30% |
0.0% |
0.0% |
100.0% |
30.1 to 50% |
58.8% |
5.9% |
35.3% |
50.1 to 80% |
58.8% |
17.6% |
23.5% |
80.1 to 100% |
81.8% |
18.2% |
0.0% |
>100% |
100.0% |
0.0% |
0.0% |
Housing problems in What Cheer, Iowa
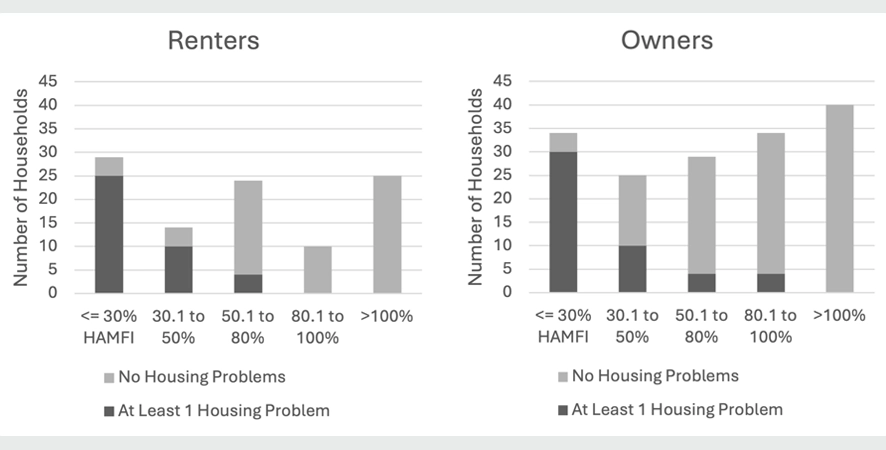
For our next example, a community planner is tasked with learning more about the prevalence of housing problems in the city of What Cheer, Iowa. CHAS defines a household with a housing problem as a household with at least one of the following issues: incomplete kitchen or plumbing facilities, overcrowding (more than one person per room in the residence), and a housing cost burden exceeding 30 percent of income. CHAS directly addresses this question and further breaks down the counts by tenure and household income, which are all available through the CHAS Query Tool. Figure 3 shows that the proportion of households in What Cheer experiencing one or more housing problems is highly correlated with household income for both renter and owner households. No households in the community with an income exceeding the area median reported having a housing problem, whereas most households earning no more than 30 percent of HAMFI have at least one housing problem.
Figure 3. Presence of housing problems by tenure and household income category in What Cheer, Iowa

Housing affordability in Bird-in-Hand, Pennsylvania
Next, a team of program administrators want to explore issues of affordability in communities across the country. The Query Tool does not directly address questions of affordability; instead, the program administrators must turn to the full CHAS dataset and the data dictionary included in all CHAS downloads — specifically, the Table List page, which includes a detailed list of all the available tables (figure 4).
Figure 4. Partial Table List in CHAS Data Dictionary

CHAS tables 14 and 15 are designed to answer questions about rental and ownership affordability. These tables do not reflect the cost burden facing current residents of housing units but rather the affordability of those housing units to a hypothetical low- or moderate-income resident based on the current rent or estimated monthly costs for ownership units. In other words, Tables 14 and 15 tally the number of units in a defined area that would or would not be affordable at specified incomes, such as 80 percent or 50 percent of HAMFI. On Zillow, the lowest list price for a recently sold 2-bedroom home in Bird-in-Hand is $305,000. Would that home be affordable for a hypothetical three-person household earning 50 percent of HAMFI ($38,295)? The CHAS data assess owner affordability using a home value to income ratio of 3.36; this ratio is based on assumptions regarding interest rates, downpayment amount, insurance, and property taxes. So, in the case of Bird-in-Hand, a three-person household earning 50 percent of HAMFI could afford to own a home with a value up to $128,671 (3.36 x $38,295); only one home out of the 34 listed on Zillow as sold in the past 6 months would be affordable to this household.
Rental affordability is assessed by comparing gross rents (including utilities) for all units that are renter occupied or listed for rent to 30 percent of monthly income at the HAMFI threshold. In Bird-in-Hand, none of the 60 2-bedroom rental units in CHAS would be affordable for a 3-person household earning $38,295.
Housing affordability and availability in Yolo County, California
Administrators can use CHAS to estimate the number of units that are affordable and available in a given community. In addition to counting only housing units that have rents or prices affordable to a certain income threshold, this option further restricts the count to those units considered "available," which CHAS defines in two ways: (1) the traditional definition, meaning that a unit is either vacant and for sale or rent, or (2) a unit currently occupied by a household earning an income less than or equal to the specified income threshold. According to the second definition, if a household earning more than the specified income level is currently occupying a unit, CHAS does not count the unit as affordable and available even if the rent or price of the unit is affordable to a household earning the specified income level.
In our example, the administrators want to know the number of available and affordable units in Yolo County, California, for a four-person family earning 80 percent of HAMFI ($74,800). To answer this question, they use the full CHAS dataset and focus on Tables 14 and 15. According to Tables 14B and 15C in the 2021 CHAS, the county has 36,680 total renter-occupied or vacant rental units. By applying the affordability definitions discussed earlier, CHAS estimates that 23,365 (64%) of the rental units are affordable at 80 percent of HAMFI, but only 16,795 (46%) of rental units are both affordable and available, meaning that 18 percent of rental units are affordable but are occupied by households with incomes exceeding 80 percent of HAMFI. On the ownership side, the county has 39,015 owner-occupied or vacant for-sale units, per Tables 14A, 15A, and 15B. Only 4,930 (13%) of those units are affordable at 80 percent of HAMFI, and 2,595 (7%) are affordable and available.
We are interested in hearing from you. How are you using CHAS? What other documentation would be helpful? Please send your feedback to helpdesk@huduser.gov with "CHAS Edge feedback" as the subject line.
CHAS includes the following income categories: Household income less than or equal to 30% HAMFI; household income greater than 30% but less than 50% HAMFI; household income greater than 50% but less than 80% HAMFI; household income greater than 80% but less than 100% HAMFI; household income greater than 100% HAMFI. ×
More detailed data downloads are available using the "Data" tab, which includes a data dictionary. ×
Because variables such as housing cost burden are included in multiple CHAS tables, several methods of deriving a final estimate exist. A data user's most efficient method is to use the table in which the variable of interest is highest in the hierarchy of variables. ×
Zillow. 2024. “Recently sold homes in approximate CHAS boundary for Bird-in-Hand, Pennsylvania.” Accessed 3 December 2024. ×
Zillow. 2024. “Recently sold homes in approximate CHAS boundary for Bird-in-Hand, Pennsylvania.” Accessed 3 December 2024. ×


