July/August 2008
In this Issue
Toward Understanding Homelessness
Homelessness: A National Perspective
Calculating the True Cost of Housing
A Focus on Fair Housing
In the next issue of ResearchWorks
Calculating the True Cost of Housing
Americans have traditionally been willing to travel long distances to find affordable housing. However, record gas prices and higher transportation costs may be changing the way households and policymakers think about affordable housing. Residences located farther from work, schools, shopping, and amenities require longer and more frequent — and therefore more expensive — trips, making the once-affordable suburban home a less economical choice than urban housing located closer to public transportation and employment centers.
Measuring Housing Affordability
The Center for Neighborhood Technology (CNT), in partnership with the Brookings Institution's Urban Initiatives program, has developed a measure that factors in transportation costs and housing expenses to provide a more accurate picture of affordability than housing costs alone. The measure uses widely available housing, homeownership, and rental cost data published in the 2000 U.S. Census as the initial framework. Transportation costs were developed using regression analysis of household and neighborhood location variables that include household income, household size, workers per household, households per acre, average block size, and a transit activity index (which measures mass transit routes available within walking distance). The input variables are then used to forecast three output variables — car ownership, car usage, and public transportation usage — that are combined to arrive at average transportation costs per household for each census block.
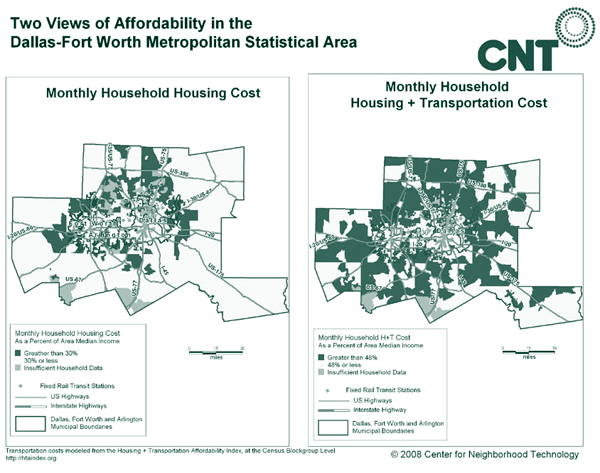
CNT used regression analysis to predict transportation costs for neighborhood locations (as approximated by census blocks) in 52 metropolitan areas. To capture differences in metropolitan density, development patterns, and transportation usage that directly affect transportation costs, CNT used cluster analysis to select six prototype cluster regions (Atlanta, Buffalo, Chicago, Fort Wayne, Memphis, and New York) for the underlying transportation cost formulas. The transportation costs for a given metropolitan area are based on the prototype cluster region that it best approximates. For example, transportation data for regions with high levels of car ownership, low transit use, and low residential density, such as Dallas and Minneapolis, are based on the regression developed for the Atlanta prototype region. Regions that have lower levels of car ownership, higher transit use, and higher residential density, such as the Washington, D.C.-Baltimore metropolitan area, use formulas developed for the Chicago prototype.
 |
A Practical Tool
The result is a new interactive web-mapping tool that incorporates both housing and transportation costs to measure neighborhood affordability. The tool's underlying
research-based assumption is that areas in which housing plus transportation costs are less than 48 percent of area median income (30 percent or less for housing costs plus 18 percent or less for transportation costs) fall within the definition of affordable. The latter figure comes from U.S. Department of Labor reports showing that U.S. households spent an average of 18 percent of their annual budgets on transportation costs in 2004. CNT research suggests, however, that 15 percent is feasible, given good transportation planning.
The Housing + Transportation Affordability Index is a practical tool for consumers, policymakers, and housing and transportation advocates. It allows users to view regional maps, zooming in to isolate neighborhood areas and view housing and transportation data at the census-block level. Users see maps of the household, environmental, and output variables using the Affordability Index's advanced mapping features.
This interactive web-mapping tool presents housing affordability information in three ways. The first portrays housing costs alone, defining affordable housing as that costing 30 percent or less of a household's annual household income. The second illustrates the expanded affordability definition of housing plus transportation costs. The third highlights metropolitan neighborhoods that meet a benchmark affordability goal of housing plus transportation costs that are 45 percent or less of area median income.
The index is a valuable resource for government officials and funders seeking to improve housing affordability by increasing access to public transportation, promoting walkable neighborhoods, and encouraging the development of amenities closer to existing neighborhoods. In addition, the index's transportation affordability goal offers officials an objective to work toward in reducing neighborhood transportation costs.
The Housing + Transportation Affordability Index can be found at http://htaindex.cnt.org. Additional information on development of the index is available in The Affordability Index: A New Tool for Measuring the True Affordability of a Housing Choice, which can be downloaded free of charge at www.brookings.edu/reports/2006/01_affordability_index.aspx.

