November 2008
In this Issue
Resources Mitigate the Impact of Major Disasters
Rising Housing Costs 1985 – 2005: A Closer Look
Housing and Economic Recovery Act of 2008 Boosts Energy-Efficient Mortgages
Riding For Affordable Housing
In the next issue of ResearchWorks
Rising Housing Costs 1985 – 2005: A Closer Look
It's no secret that housing costs climbed steadily between 1985 and 2005, but rising prices affect different people in different ways. A new HUD report, Trends in Housing Costs: 1985 – 2005 and the 30-Percent-of-Income Standard, details changes experienced by three different household groups: homeowners with mortgages, homeowners without mortgages, and renters. Trends in Housing Costs also explores the 30-percent-of-income standard in light of these changes. The standard refers to a longstanding housing policy guideline, grounded in the belief that households who must pay more than 30 percent of their income for housing may be forced to forego other necessary goods and services. The research is part of HUD's efforts to optimize use of the American Housing Survey (AHS), a biennial record of the quality, use, and condition of the nation's housing stock.
Overall Trend in Housing Costs
Housing cost components include electricity, gas, fuel oil, other fuels (like wood, coal, kerosene), trash, water and sewage, real estate taxes, property insurance, fees (condominium, homeowner association, mobile home park), and rents, or, in the case of homeowners, mortgage payments, payments on lump-sum home equity loans, land or site rents, and routine maintenance. Researchers found that between 1985 and 2005, these shelter costs rose by 104 percent — faster than those of other consumer items. By comparison, the cost of all other consumer items grew by 74 percent during the same period.
Housing Cost Changes for Different Household Groups
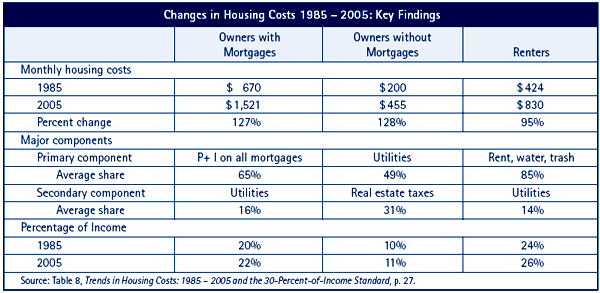
The most substantial components of housing costs for mortgage-holders were principal and interest payments (P+I) and lump-sum home equity loan payments, accounting for about two-thirds of total housing outlay for the period. Utility costs were the second most expensive item, although their share declined from more than 20 percent to approximately 13 percent between 1985 and 2005. Real estate taxes, which rose slightly from 10 to 14 percent during this time, were the third-largest housing outlay for this group. For owners without mortgages, utilities were the most expensive, although their share of housing costs fell from 64 percent in 1985 to 39 percent in 2005. Renters had few housing expenses beyond the sum of rent plus utilities, which accounted for 99 percent of their housing expenditures.
Homeowners with mortgages saw monthly housing costs more than double in noninflation-adjusted dollars, from $670 to $1,521, or 127 percent, as shown in the accompanying table. This represents a 25-percent increase in inflation-adjusted (or constant) dollars. Similarly, the monthly housing costs of homeowners without mortgages rose from $200 to $455, a 128-percent increase, or a constant dollar increase of 25 percent. Housing costs for renters showed a similar pattern, increasing from $424 to $830 over the period, a 95-percent increase, or 8 percent in constant dollars.
As a percentage of income, monthly housing costs rose slightly for all three groups, increasing from 20 to 22 percent for mortgage holders, from 10 to 11 percent for homeowners without mortgages, and from 24 to 26 percent for renters. In each case, analysts attributed these small increases to rising costs and declining income.
 |
|---|
Implications for the Affordability Standard
Despite cost increases, the report notes, housing remains a large part of American consumption and investment, as evidenced by growing homeownership rates and an expanding average home size. What implications might these increases have for the 30-percent housing affordability standard? To answer this question, the authors apply two methodologies: one using AHS data and another using Bureau of Labor Statistics (BLS) data.
The first method assumes that the 30-percent standard used in 1985 was adequate. By comparing levels of nonhousing consumption in 1985 and 2005, researchers discovered that households were able to sustain a higher level of nonhousing consumption in 2005 than they did in 1985 — if they spent 30 percent of their income on housing. Researchers also examined households at seven different levels of income, from extremely-low-income to extremely-high-income (in relation to local area median income), and found that all income groups in 2005 would be able to spend 30 percent or more of their income on housing if they consumed the same level of nonhousing goods and services as they did in 1985. The same is true when looking at income groups within the categories of renters, owners with mortgages, and owners without mortgages. The pattern also holds for elderly households, households with or without children, and most households of different races and ethnicities.
The second method of analysis used BLS data that priced bundles of goods and services, representing lower, intermediate, and higher levels of consumption for a family of four, to approximate nonhousing consumption levels. Investigators estimated that low-level expenditures on nonhousing, taxes, and other items would total $27,013 in 2005 dollars. Moderate- and higher-income households, in general, were able to afford this expenditure level while spending 30 percent of their income for housing. Although the 30-percent standard appeared to work effectively for moderate- and higher-income households, it did not appear adequate for those below the moderate-income level.
Although results of the two tests lead to similar conclusions, researchers caution that these assessments are tentative because of imperfect data, such as possible underestimated shelter costs, inadequate adjustments for inflation, and a shift of household expenditure choices relative to nonhousing costs. Trends in Housing Costs: 1985 – 2005 and the 30-Percent-of-Income Standard is available at www.huduser.gov/portal/publications/pdf/Trends_hsg_costs_85-2005.pdf, where it can be downloaded at no cost.
 HUD's Office of Policy Development and Research, in conjunction with the Department's Healthy Homes Initiative, recently released Rehabbing Flooded Houses: A Guide for Builders and Contractors. The guide emphasizes safe rehabilitation practices, such as identifying common health hazards in flooded homes, determining a home's structural soundness, and preventing or minimizing damage from future flooding. Presented in two languages (English and Spanish), the guidebook includes information on how to determine required repairs, an explanation of the different types of flood resistance, and tables that list flood-resistant building components, flooring materials, wall and ceiling materials, and government-sponsored information resources. This manual is available as a free download from HUD USER at www.huduser.gov/ publications/destech/Rehab_Flood_Houses.html. HUD's Office of Policy Development and Research, in conjunction with the Department's Healthy Homes Initiative, recently released Rehabbing Flooded Houses: A Guide for Builders and Contractors. The guide emphasizes safe rehabilitation practices, such as identifying common health hazards in flooded homes, determining a home's structural soundness, and preventing or minimizing damage from future flooding. Presented in two languages (English and Spanish), the guidebook includes information on how to determine required repairs, an explanation of the different types of flood resistance, and tables that list flood-resistant building components, flooring materials, wall and ceiling materials, and government-sponsored information resources. This manual is available as a free download from HUD USER at www.huduser.gov/ publications/destech/Rehab_Flood_Houses.html. |

