September 2008
In this Issue
Untangling the Sources of Mortgage Closing Costs
HECM Program: Coming Into Its Own
Energy Efficiency Inside and Out
Every Picture Tells a Story: Data Images of Subsidized Households
In the next issue of ResearchWorks
Every Picture Tells a Story: Data Images of Subsidized Households
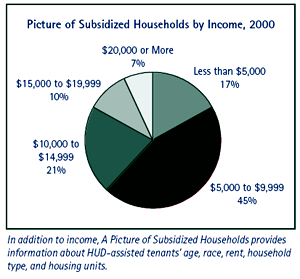
Serving as a tool for researchers and policy analysts, A Picture of Subsidized Households (Picture) summarizes data on nearly 5 million households living in HUD-assisted housing nationwide. Picture aggregates information by program at the national; metropolitan statistical area; state, city, census tract; and public housing authority levels. This comprehensive database on subsidized households is compiled from HUD's major data collection systems and made available by HUD's Office of Policy Development and Research.
Much of the data in Picture depict characteristics of participants in HUD's rental subsidy program. Without betraying confidentiality, the information includes tenant descriptors such as age, race, rent, income, household type (e.g., elderly, disabled, or families with children), and characteristics of both the housing unit and the surrounding neighborhood. For multifamily assisted housing and public housing, the database reports the total number of units, percentage occupied, number reported, household contributions toward rent and utilities, and federal spending per unit. Neighborhood characteristics include poverty, minority, and single-family ownership data.
 Picture data exist for the 1970s, 1996, 1997, 1998, and 2000; a 2004 release is imminent. Beginning with Picture 2000, users can access the data with a web-based query tool. Researchers view the results of the query as a web-based report or as a comma-delimited file available for downloading and further statistical analysis. Users can also download the data and related documentation from the website.
HUD social science analyst Lydia Taghavi describes how to use the database in a recent issue of Cityscape, HUD's journal of policy development and research. Taghavi shows how analysts can use the census tract data in Picture to map the locations of assisted housing in a community. Another example demonstrates using Picture data to see the distribution of households participating in the housing choice voucher program by location and by neighborhood poverty rate, as well as to determine the dispersion of those households headed by elderly tenants.
Other examples found in the research literature illustrate Picture's role in compiling reports for Millennial Housing Commission studies; studying the effects of segregation on neighborhood crime rates; pinpointing the relationship between welfare and housing assistance and the nature of their overlap; finding new models for public housing developments to replace old high-rise, high-density models; studying the impact of subsidized housing on the housing stock; and assessing changes over time in the characteristics of nonmetropolitan public housing residents.
Although these applications are indicative of its versatility, Picture is not without limitations, which are explained in the online supporting documentation accompanying the data for each period (see www.huduser.gov/datasets/assthsg.html). To read Taghavi's article, go to "HUD-Assisted Housing 101: Using 'A Picture of Subsidized Households: 2000'" in Cityscape (volume 10, number 1) at www.huduser.gov/ periodicals/cityscpe/vol10num1/index.html, or order a print copy of the issue by calling HUD USER at 800.245.2691, option 1.

