December/January 2008
In this Issue
Three Decades of Housing Data
Mixed-Financing Underwrites Affordable Housing in Southwest Virginia
A Lean Makeover for Factory-Built Housing Production
Housing First for the Chronically Homeless Mentally Ill
In the next issue of ResearchWorks
Three Decades of Housing Data
A recent study prepared for HUD’s Office of Policy Development and Research portrays changes in American housing and households using the American Housing Surveys (AHSs) from 1973 to 2005. The report, 32 Years of Housing Data, statistically describes developments in housing that occurred in tandem with extensive demographic shifts in a population that grew larger, older, and more diverse. Some of the most compelling findings from this study are highlighted below.

Changes in American Housing Stock, 1973 – 2005
-
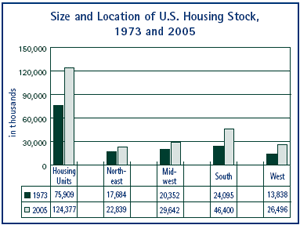
The number of housing units dramatically increased. The number rose by 64 percent from around 76 million in 1973 to over 124 million in 2005.
-
The distribution of housing shifted. A proportionate loss of share in the Northeast and Midwest was gained in the South and West.
-
The share of housing located in metropolitan areas increased. Among the total housing stock, housing inside metropolitan areas increased from 67 to 76 percent. Within metropolitan areas, city centers lost housing while the share of housing units in the suburbs grew larger, from 53 to 62 percent of all metropolitan units.
-
Living space expanded. The median number of rooms in year-round housing units rose from 5.0 rooms to 5.5 rooms, while the median number of bedrooms increased from 2.5 bedrooms to 2.7 bedrooms.
-
Floor plans grew larger, but lot size remained the same. The median square footage of a single-family detached or mobile home was 1,610 square feet in 1985; it increased to 1,774 square feet by 2005. The median lot size for a one-unit structure was 0.36 acre in both years.
-
Overcrowding declined. In 1973, 6 percent of occupied units had more than one person per room; in 2005, the rate had dropped to 2.4 percent.

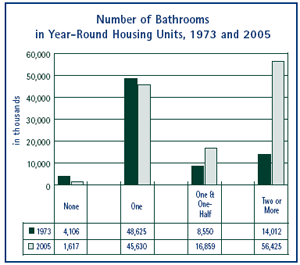
Bathrooms multiplied. The share of units without bathrooms dropped from 5.5 to 1.3 percent. Thirty percent of housing units had 1.5 bathrooms or more in 1973; 32 years later, this number has increased to 61 percent.
-
Air conditioning became standard. The share of year-round units without air conditioning declined dramatically, from 53 percent to 13 percent.
-
Overall quality of the housing stock improved. Nearly 4 percent of occupied units had a variety of moderate physical problems in 2005, compared to 6.6 percent in 1985. With regard to electrical systems, defects such as exposed wiring, inadequate outlets, and blown fuses or breakers were reported by 11 percent of households in occupied units in 2005, as opposed to 24 percent in 1973.
Housing Costs, 1973 – 2005
-
Housing costs for renters increased. In 1973, 23 percent of renters paid 35 percent or more of their income for housing costs; by 2005, 41 percent of renters did so.
-
Housing costs for owners increased. In 1974, 8 percent of owners paid 35 percent or more of their income for housing costs; by 2005, 22 percent of owners did so.
-
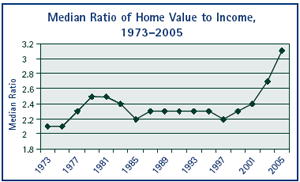
The ratio of home value to income increased in two phases. From 1973 to 1979, the ratio increased from 2.1 to 2.5. It reached a plateau at 2.3 from 1985 to 1999. Then, by 2005, the ratio rose sharply to 3.1.
Characteristics of American Householders, 1973 – 2005
-
More Americans became homeowners. The home–ownership rate rose from 64.4 to 68.8 percent.
-
The composition of households changed. In 1973, approximately 2 out of 3 were married-couple families; by 2005, this ratio fell to 1 out of 2.

The median household size dropped from 2.5 persons to 2.2 persons. Large households decreased. Households with 5 or more members represented 18 percent of all households in 1973, but only 10 percent by 2005.
-
Households with children decreased. From 1973 to 2005, the percentage dropped from 43 percent to 35 percent of all households.
-
Elderly householders aged 65 and over accounted for 20 percent of those occupying the nation’s housing stock in 1973, and that percentage remained constant in 2005. There was, however, a slight increase in the proportion of those over 75.
-
Householders traveled slightly longer and further to get to work. The median commuting time increased from 19 minutes in 1974 to 22 minutes in 2005; the median commuting distance increased from 8 to 11 miles.
The data reported by the AHS are consistent with those reported by other national surveys, such as the decennial census and the American Community Survey. What makes the AHS unique is its ability to link household and housing features. Extensive analyses of the relationship between housing and household characteristics are possible using the public use files found at www.huduser.gov/datasets/ahs.html. The direct link to 32 Years of Housing Data can be found at www.huduser.gov/datasets/ahs/AHS_taskC.pdf, and the report can be downloaded at no cost.

