October 2009
In this Issue
Research-Oriented Leadership Welcomed
Analysts Reveal Housing Inventory Changes
Updating the National Perspective on Homelessness
HomeBase Focuses on Homelessness Prevention
In the next issue of ResearchWorks
Analysts Reveal Housing Inventory Changes
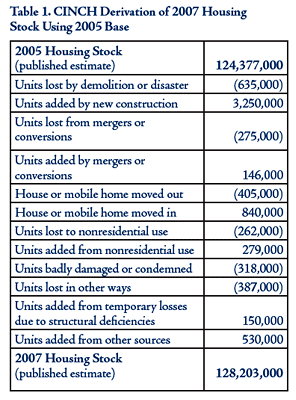
Housing analysts study how the nation's housing inventory changes over time with a tool known as CINCH (short for Components of Inventory Change). According to the American Housing Survey (AHS), the estimated total inventory in 2005 was 124.377 million housing units. By 2007, new construction and other additions to the housing supply had exceeded any losses during the intervening time by 3.826 million units. Although the U.S. Census Bureau reports numbers of newly constructed units between 2005 and 2007, no other estimates of units that were added, lost, or remained in the inventory were available. A recent CINCH analysis, completed by Econometrica, Inc. for HUD's Office of Policy Development & Research, supplies the missing estimates for this period.
 The AHS longitudinal data allowed CINCH analysts
to track unit histories and statistically estimate just how the inventory had changed. Losses and additions
to the stock were identified and disaggregated to
estimate the quantity and types of shifts that occurred.
Additions to the inventory were attributed to new
construction, inbound mobile home units, conversions
of nonresidential properties, restoration of previously
uninhabitable units, and miscellaneous other events.
Losses were attributed to natural disasters or planned
demolishment, mergers with other units, conversions
into multiple units, outbound mobile home units,
conversions to nonresidential use, badly damaged or
condemned units, and other transactions. The analysis
thus revealed the underlying dynamics that shape the
housing stock (see table 1).
 Together with this research is an analysis to determine
whether the number of rental units affordable to
lower-income households grew or declined between
2005 and 2007, and to what this growth or decline
is attributable. To answer these questions, analysts
sorted the rental stock into eight categories defined
by affordability of gross rents, with the upper limit of
affordability set at 30 percent of each category’s upper
income boundary:
1. Nonmarket (no cash or subsidized rent).
2. Extremely low rent (affordable to incomes ![]() 30
percent of local area median income (AMI).
30
percent of local area median income (AMI).
3. Very-low rent (affordable to incomes between 30 and 50 percent of AMI).
4. Low rent (affordable to incomes between 50 and 60 percent of AMI).
5. Moderate rent (affordable to incomes between 60 and 80 percent of AMI).
6. High rent (affordable to incomes between 80 and 100 percent of AMI).
7. Very-high rent (affordable to incomes between 100 and 120 percent of AMI).
8. Extremely high rent (affordable to incomes >120 percent of AMI).
Researchers found a combined decline of 1.5 to 2.0 million units in the number of nonmarket, extremely low-rent, and very-low-rent units. Movement in and out of the rental stock caused nearly one-fourth of the decline, and approximately 75 percent of the drop was due to net movement into and out of other affordability categories. A roughly concomitant increase occurred in the low- and moderate-rent affordability categories.
To see and download the several reports generated by this project, go to www.huduser.gov/datasets/cinch.html. A microdata set containing CINCH records and weights for all AHS observations is available, and researchers can link this data set to AHS files to produce custom tabulations.

