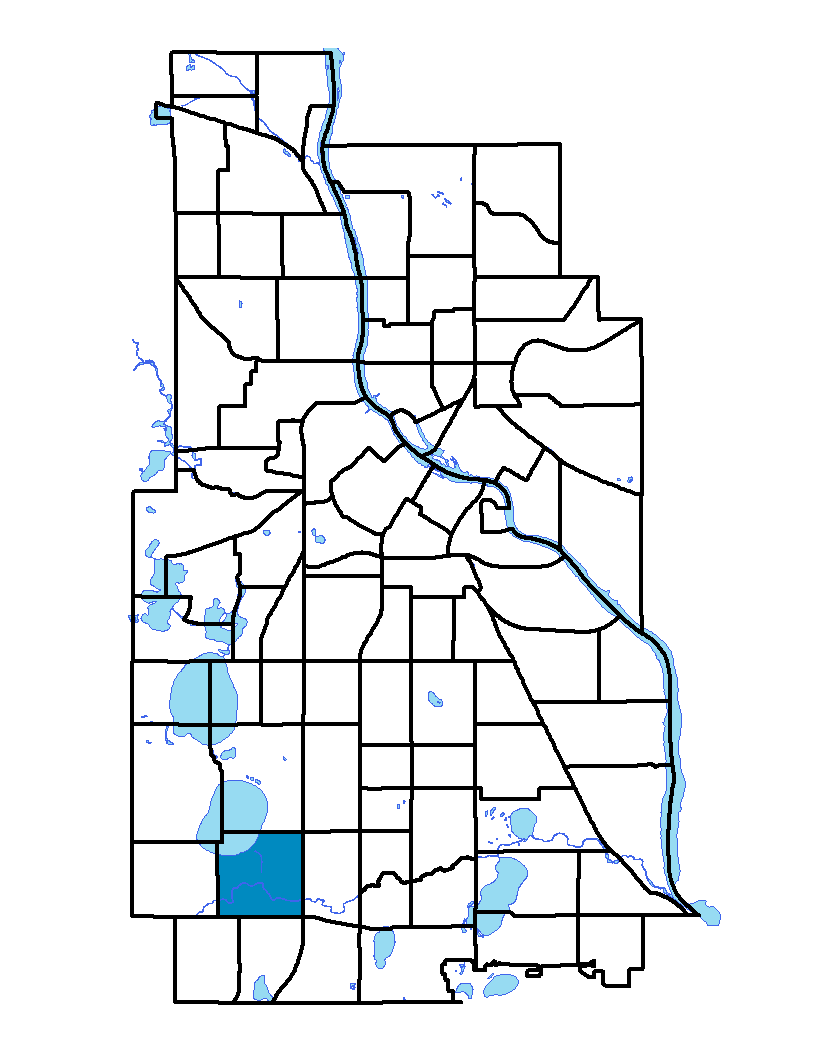
Lynnhurst neighborhood is located in southwest Minneapolis at the southern edge of Lake Harriet. Minnehaha Creek runs from north to southeast, bisecting the neighborhood. Lynnhurst extends from Lyndale Avenue to Penn Avenue and from 46th Street to 54th Street. It gets its name from a neighborhood park, located at the intersection of West 50th Street and West Minnehaha Parkway. The park was named for its location in the Lynnhurst Planning District, which was most likely named for the abundance of linden trees in the area. The park's name was adopted in 1921, the same year the 8.21 acres of parkland were purchased. Lynnhurst is a residential neighborhood with most of its housing stock built before 1940.
To learn more about the neighborhood association visit: www.lynnhurst.org
Indicator Details
|
Indicators |
Primary Domain | Indicator Value | Rank | Tier |
|---|---|---|---|---|
| Access to Mainstream Financial Services | Economic Health | 8.6% | 4 | Top |
| Access to Parks and Open Space | Natural Areas | 11.6% | 25 | Top |
| Adult Educational Attainment | Educational Opportunities | 98.7% | 5 | Top |
| Age of Housing | Housing | 96.1% | 80 | Bottom |
| Blood Lead Levels in Children | Housing | 2.5% | 28 | Top |
| Business Retention | Economic Health | -1.7% | 74 | Bottom |
| Chronic School Absence | Health Systems and Public Safety | -% | - | Data N/A |
| Commute Mode Share | Transportation | 17.0% | 71 | Bottom |
| Employment Rate | Employment Opportunities | 73.0% | 21 | Top |
| Excessive Housing Cost Burden | Housing | 19.5% | 10 | Top |
| Food Desert | Neighborhood Characteristics | -% | - | Data N/A |
| High School Graduation Rate | Educational Opportunities | -% | - | Data N/A |
| Household Transportation Costs | Transportation | 19.5% | 82 | Bottom |
| Local Business Vitality | Economic Health | 68.2% | 11 | Top |
| Long-Term Unemployment | Employment Opportunities | 4.2% | 20 | Top |
| Low Birth Weight | Health Systems and Public Safety | 8.1% | 51 | Middle |
| Motor Vehicle Collisions | Health Systems and Public Safety | 1.1 | 9 | Top |
| Offsite Alcohol Outlets | Neighborhood Characteristics | 0.2 | 1 | Top |
| Pedestrian Connectivity | Transportation | 139.1 | 37 | Middle |
| Preschool Enrollment | Educational Opportunities | 68.0% | 17 | Top |
| Preventable Hospitalizations | Health Systems and Public Safety | 1.3 | 8 | Top |
| Proximity to Brownfield Sites | Environmental Hazards | 0.0% | 1 | Top |
| Proximity to Superfund Sites | Environmental Hazards | 0.0% | 1 | Top |
| Public Assisted Households | Employment Opportunities | 8.3% | 20 | Top |
| Reading Proficiency | Educational Opportunities | 76.3% | 4 | Top |
| Residential Mobility | Social Cohesion | 88.2% | 11 | Top |
| Residential Proximity to Traffic | Environmental Hazards | 0.0% | 1 | Top |
| School Proximity to Traffic | Environmental Hazards | -% | - | Data N/A |
| School Readiness Scores | Educational Opportunities | -% | - | Data N/A |
| Toxic Releases from Facilities | Environmental Hazards | 0.0% | 1 | Top |
| Transit Accessibility | Transportation | 314.5 | 42 | Middle |
| Travel Time to Work | Employment Opportunities | 22.9 minutes | 55 | Middle |
| Tree Cover | Natural Areas | 32.9% | 17 | Top |
| Vacancy Rates | Housing | 4.2% | 12 | Top |
| Violent Crime | Health Systems and Public Safety | 17 | 3 | Top |
| Voter Participation | Social Cohesion | 52.7% | 2 | Top |
| Walkability | Neighborhood Characteristics | 56 | 59 | Bottom |